The charts below reflect an older data snapshot, so the focus here is the analytical method rather than a current ranking of U.S. ecosystems.
Location analysis is a good example of how small public datasets can still produce useful business questions. When teams evaluate startup ecosystems, regional demand, or expansion opportunities, the goal is usually not to declare one city or state the universal winner. It is to understand where density, talent, capital, and operating conditions line up for a specific strategy.
What This Type Of Analysis Is Actually Good For
A regional startup analysis can help answer questions such as:
- where startup density is strongest
- which regions combine company formation with hiring activity
- where investor presence appears strong relative to company count
- which secondary regions look more attractive once the obvious outliers are removed
That last point matters. If you only chart absolute counts, California and New York will dominate many views and obscure more nuanced signals in other states.
The Original Dataset
The original version of this post used Angel.co state-level counts for:
- companies
- investors
- followers
- jobs
That is enough to demonstrate a useful pattern: absolute counts help identify dominant ecosystems, while normalized metrics help reveal regions that are small but efficient or unusually active.
A Better Method For Reading Startup Geography
For a modern analysis, use three layers.
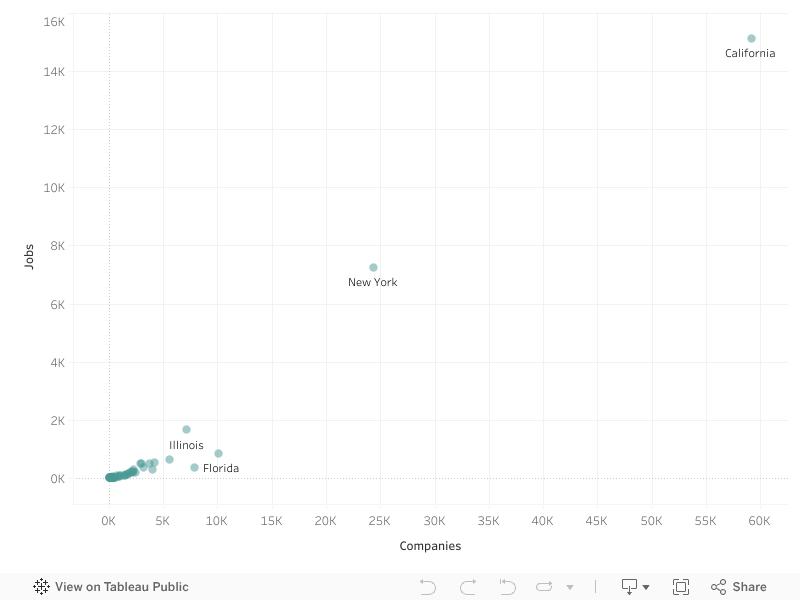
1. Absolute Scale
Start with raw counts to see where startup and hiring activity concentrate.
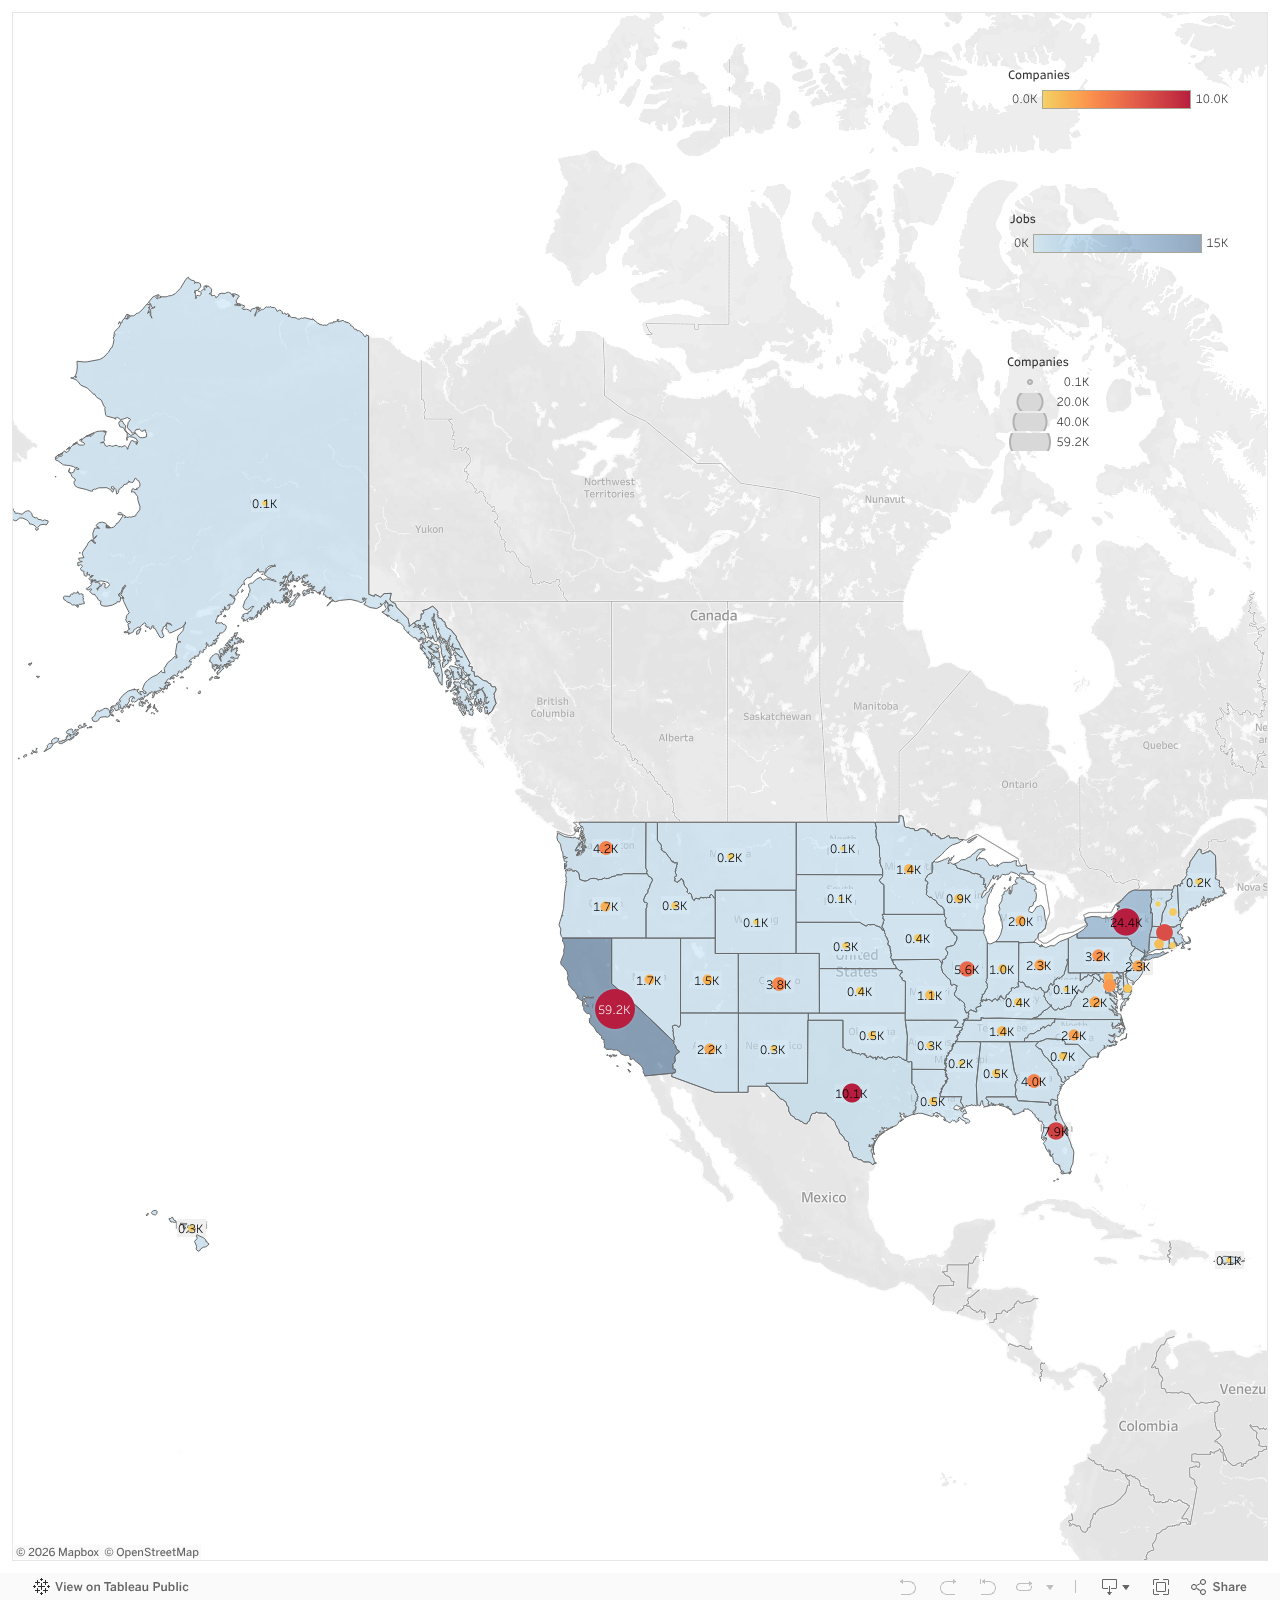

This shows the large hubs clearly, but it tells you very little about the relative quality of smaller ecosystems.
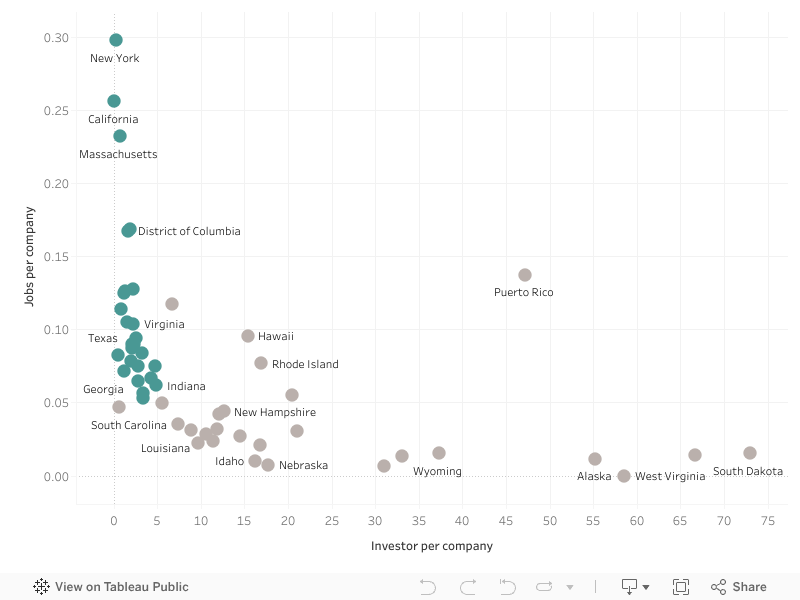
2. Relative Efficiency
Next, normalize key measures. Jobs per company, investors per company, or followers per company can highlight places that punch above their weight.

That is often the step where secondary regions become visible.
3. Strategic Fit
Finally, compare those patterns against the business question:
- recruiting
- fundraising access
- customer concentration
- operating cost
- ecosystem specialization
The “best” region changes depending on which outcome matters most.
What The Original Example Still Shows Well
The old Tableau example still demonstrates a sound analytical move:
- start with absolute values
- identify outliers
- normalize the data
- replot the landscape
- look for states that become more interesting after weighting
That basic workflow is still useful today in market selection, territory planning, and ecosystem analysis.


Limits To Keep In Mind
Any serious modern location analysis should go beyond a single public source. Startup ecosystems shift quickly, and state-level counts alone do not capture:
- sector specialization
- quality of talent supply
- enterprise customer proximity
- remote-first operating models
- venture climate changes over time
So treat this style of analysis as a first-pass exploration, not a final strategic answer.
Final Takeaway
The durable lesson is not which state topped an older ranking. It is that the right normalization choices can expose high-potential regions that disappear inside simple volume charts.
Need Help Turning Public and Internal Data Into Better Market Decisions?
ActiveWizards helps companies build analytics workflows for regional analysis, market selection, and decision support so strategy is grounded in real signals rather than intuition alone.