NLP and data visualization for UNDP

We proposed a method of an automated SDG and relationships recognition. Used on the corpus of the UN reports about sustainable development it yielded more than 100,000 connections that, hopefully, will clarify complex relationships between the goals and obstacles.
Sustainable development as an approach tries to understand the world in an integrated, systemic way and focuses on the links among areas. The recently adopted United Nations Sustainable Development Goals (SDGs) have defined 17 goal areas, from poverty to oceans to inequality, ecosystems, economic growth, education, etc. Multiple relationships exist among all these goals. A challenge going forward is to better understand them, and map them in a way that is easy to understand while preserving the complexity of the whole. Institutions working on specific areas of sustainable development (e.g. education, energy, slums, etc.) tend to explore and focus on limited aspects of the map. Their policy messages emphasize the importance of specific links. However, for policy discussions, the whole map is needed.
So we built an automated tool that extracts from a set of UN publications all the messages that relate to the relationships between urban development (SDG 11), and all the other SDG areas, and then visualize the results. We propose a method of an automated SDG and relationships recognition. Used on the corpus of the UN reports about sustainable development it yielded more than 100,000 connections that, hopefully, will clarify complex relationships between the goals and obstacles.

In order to reach the goals of the project we have divided the task into such parts:
- To identify keywords for each United Nations Sustainable Development Goals category searching.
- To get the messages with links between urban development and all the other SDG areas.
- To identify keywords for relationships between SDGs extracting.
- To get the 4 types of relationships between links.
- Summarizing and visualizing.

Main Approaches, we have used, were:
- Word2Vec model for keywords generating.
Word2Vec is an efficient implementation of the continuous bagofwords and skipgram architectures for computing vector representations of words. We have used all Wikipedia articles for corpus creating. Then we trained the Word2Vec model and get the vector representation of each word. It allows us to get most similar words for each SDG area and for relationships of 3 and 4 types. We have chosen less than 100 from them for SDGs and relationships and have saved them into csv files.

- Text Mining for messages searching.
We have used different text mining operations for:
- splitting text into sentences
- punctuations removing
- lemmatization
- tokenization
- Data analysis
Data Analysis methods were useful for data aggregation, calculating number of links, getting number of relationships, splitting by articles and sentences.
- NLP methods
We have worked with NLP algorithms for 1 and 2 type of relations (Causal link) getting. We have minded the type of part of speech for getting the causal link in
sentences.
Solutions
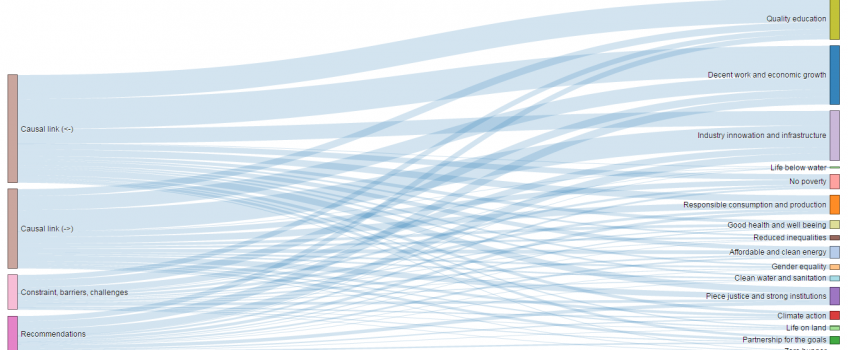
We can consider, that 'Decent work and economic growth' and 'Industry innowation and infrastructure' have the most number of links with 'Sities and Communities development'. We do not found a lot of connections between 'Life below water' category and 'Urban development'.

Speaking about types of relationships, the biggest part of link is Causal links between urban development and other SDGs. We have got more than 80, 000 links with Causal link type. In this case the number of link is almost equal distributed between the directions. Also, our visualization shows the linkages, which come from different reports. The largest contributions does IIASA Global_Energy_Assessment_FullReport and have the links to all SDGs.
Thinking about problems during the process, we can say that challenges obtain links concluded that the same word sometimes describe the SDGs.
We found useful tools such as:
- text mining: python (pandas, nltk, pdfminer, numpy)
- backend: Flask
- frontend: Bootstrap, jQuery, d3.js
You can find the full visualization here


Comments
Add a new comment: